Demo: Visualize data with Python

This demo shows you how to use BadgerCompute for visualizing data using Python's
matplotlib and pandas packages.Part of these materials are adapted from the Software Carpentries's Plotting with Python lesson.
Prerequisites
- Access to BadgerCompute
Launch BadgerCompute and upload materials
-
Launch BadgerCompute and sign in using your NetID.
-
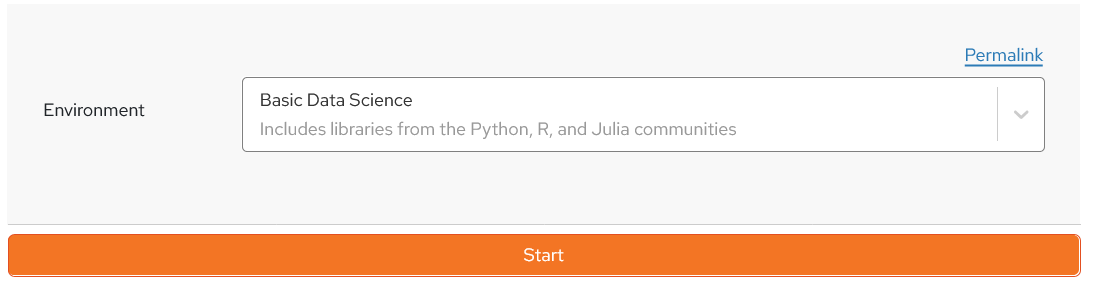
Choose the "Basic Data Science" environment. Click "Start".
-
In the left-hand sidebar (navigation), double-click the "work" folder to navigate to your
workdirectory.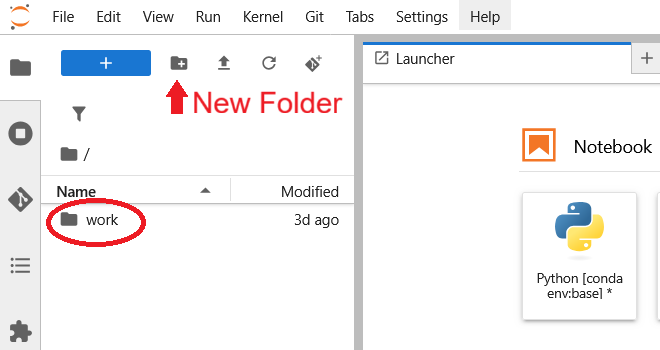
-
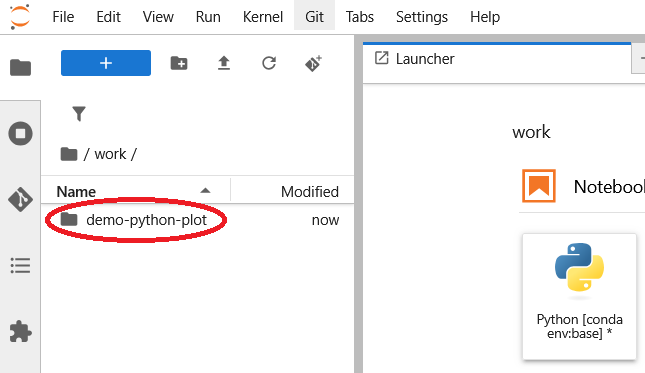
Create a new working directory by clicking the "New Folder" button. Name the directory "demo-python-plot". Double-click the newly created directory to navigate into it.
-
Click the large "+" button (or
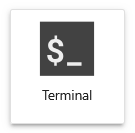
CTRL+SHIFT+L) to create a New Launcher page from the current directory. -
At the bottom of the Launcher page, click "Terminal".
-
After the terminal launches, paste the command below to copy download the materials for the demo.
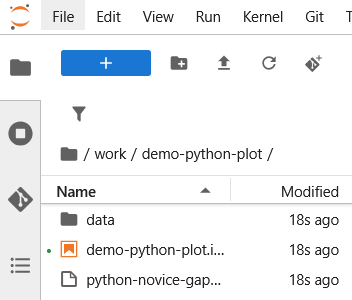
wget http://badgercompute.wisc.edu/notebooks/demo-python-plot.ipynb
wget https://swcarpentry.github.io/python-novice-gapminder/files/python-novice-gapminder-data.zip
unzip python-novice-gapminder-data.zip
In the navigation sidebar, you should see three new items:data(directory)python-novice-gapminder.zipdemo-python-plot.ipynb
-
In the navigation sidebar, double-click
demo-python-plot.ipynbto open the notebook. We will be working in this notebook for the rest of the demo.
📝 How to use the notebook
Read and follow the the rest of the guide in the notebook.
To execute code in cells (AKA "run cells"), there are multiple options.
- Click on the cell, hold
SHIFTand press theENTERkey. - Click the "Play" symbol at the top of the notebook.
- Click "Run" in the top menu bar, and select "Run Selected Cell".
🏃➡️ Continue exploring
Still want to learn more?
- Try plotting data from different
.csvfiles. - Follow along the Software Carpentry's Plotting and Programming in Python workshop, which includes more examples and exercises.
- Add interactive sliders, buttons, and more using Jupyter Widgets!


